SpatialFOFEM outputs are not limited to the extent of a landscape file, they can be confined to a portion of a landscape by the use of a mask. This can be useful when estimating emissions or fuel consumption for a prescribed burn or a wildfire perimeter or simulation.
This lesson will estimate the PM2.5 emissions for the Miller Peak Fire on July 15th & 16th.
If your project "FOFEMtutoria1.fmp" is not open, open it now and copy the ![]() Simple PM2.5 item in the Tree Pane.
Simple PM2.5 item in the Tree Pane.

Now modify the run to reflect prescribed fire conditions.
Load a mask with the  button and select the Open Limiting Shapefile option. Navigate to the C:\...FlamMap6\Tutorial\ folder and select the "Miller_Peak_Fire_July16.shp" file and click Open.
Click Apply and your SpatialFOFEM Inputs tab should look like this.

Finally select the Emissions and Carbon Outputs tab and select the Statistics CSV check box in the lower left hand corner.
Click  and the run should complete in a few seconds.
Close the "SpatialFOFEM Progress..." and "SpatialFOFEM Run:" dialogs.
Next expand the ![]() Limited PM2.5 item in the Tree Pane and select the ♦Total PM25 grid theme to display.
Limited PM2.5 item in the Tree Pane and select the ♦Total PM25 grid theme to display.

Zoom in to see some detail.

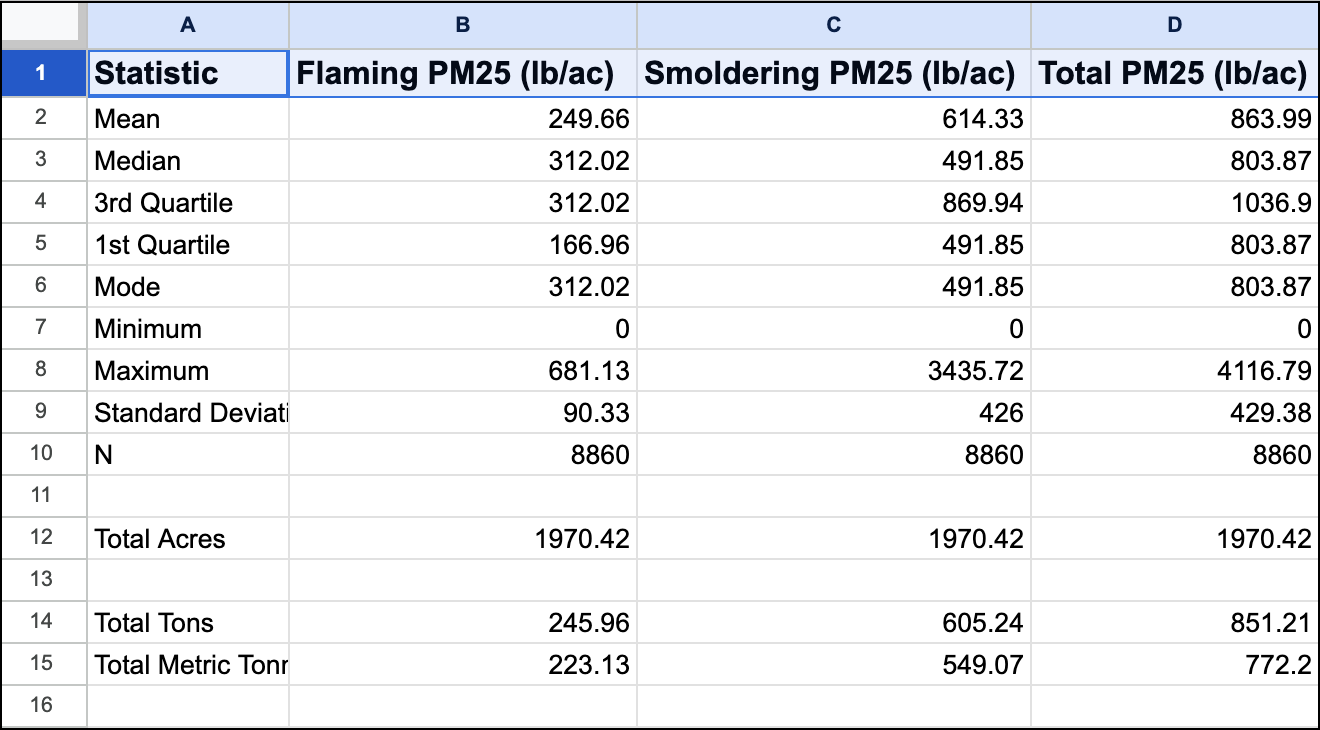
Interesting, but if you are planning a prescribed burn or environmental assessment you would want something a little more concrete. Right-click the ![]() Statistics CSV item and select the Open option from the shortcut menu.
Statistics CSV item and select the Open option from the shortcut menu.

The raw output can be a bit confusing when viewed with Notepad. But Comma Separated Value (CSV) files display nicely in a spreadsheet, just use the File>SaveAs Notepad command to save the file and then open it in a spreadsheet or database application.
You should save this project with the File > Save menu command.
You now have completed the tutorial showing how to use a mask in a SpatialFOFEM run.