Zoom into your simulation with the Zoom In ![]() button on the toolbar.
button on the toolbar.
Farsite output themes are only produced within the Farsite perimeters. Furthermore the fire behavior characteristics can be quite different for each cell as they are calculated at different landscape and weather conditions depending on the time and place "burned" with the simulation.
|
Zoom into your simulation with the Zoom In |
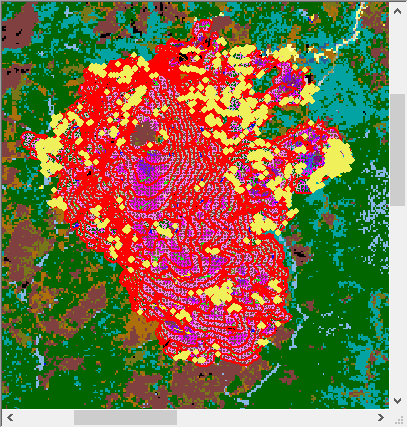
When all the vector outputs are selected the display pane can be quite a mess when first viewed. First thing is to turn off all of the vector outputs (the tree items with the ![]() check marks) by double-clicking each one. The
check marks) by double-clicking each one. The ![]() will become a red "X" indicating it is currently hidden.
will become a red "X" indicating it is currently hidden.
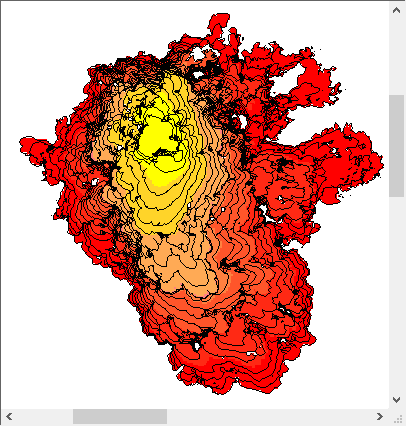
With the vector themes out of the way the grid outputs can viewed one at a time. Select ♦ Farsite Arrival Time as the active grid theme and display the legend by double-clicking the tree item or select View Legend from the Display Pane shortcut menu.
It is helpful to also display the ♦ Farsite Perimeters on top of any output rasters, it will be awkward to view the perimeters with the default red color, so change the "Properties" to the Color: black and Line Width: of 1.
The ♦ Farsite Perimeters are created for each time step, which is 60 minutes for this example.
 |
 |
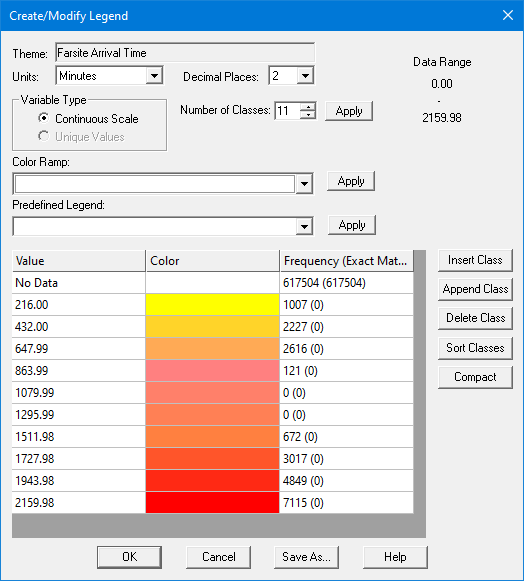
The ♦ Farsite Arrival Time theme is displayed with a yellow-red color ramp. The values for each cell are minutes, with zero being the beginning of the first burn period (7/20 0800 hrs.) and the largest value being approximately the end of the last burn period (7/21 2000 hrs.).
Remember this time range includes a non-burn period (7/20 1900 hrs. - 7/21 0700 hrs.). Fortunately, this makes it easy to define the two burn periods, the yellow-orange cells are the first burn period, and the red cells the second. No lighter red-orange cells are displayed because the center of the color ramp contains times during the non-burn period.
This non-burn period is also reflected in the Frequency column of the "Create/Modify Legend" dialog below where several time periods have zero cells.
The Flame Length for this run is displayed as feet.
Since flame length and spread rate are somewhat related you'll notice the higher flame lengths (orange or red cells) occur where the perimeters are further apart.
As you can see in the Legend dialog, which changes to reflect the currently viewed raster, the units for the ♦ Farsite Rate of Spread are chains/hour. Since the rate of spread reflects the distance between the 60 minute ♦ Farsite Perimeters it shouldn't be a surprise to see the darker (faster) colors where perimeters are widest.
The ♦ Farsite Crown Fire Activity grid has the cells classified according to the following table.
|
Crown Fire Classification |
Cell Attribute Value |
Color |
|
No Fire |
0 |
Green |
|
Surface Fire |
1 |
Yellow |
|
Passive Crown Fire (torching) |
2 |
Orange |
|
Active Crown Fire |
3 |
Red |
Notice the large area of surface fire south of the ignition. By making ♦ Canopy Cover (a landscape theme) active you can see this area has 0% canopy cover, preventing any type of crown fire.
The logic for assigning the cell attribute values is found in the Crown Fire Technical Documentation.
The vector outputs are viewed on top of a grid theme, make sure ♦ Farsite Crown Fire Activity is still the active grid.
NOTE: Due to the stochastic nature of spotting in Farsite your ♦ Spot Fire Locations and♦ Farsite Crown Fire Activity may be different from the examples below.
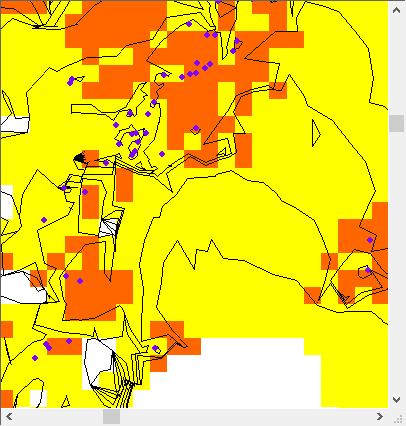 |
Display the ♦ Spot Fire Locations by double-clicking the tree pane item. it will be awkward to view the spots with the default yellow color, so change the "Properties" to the Color: purple. There are a fair number of spot fires in this simulation so instead of trying to digest the spot fire locations on the entire landscape zoom in to the area just north of the ignition using the |
Remember the symbols reflect where simulated spot fires started, not where the embers were launched from. Thus spot fires can occur in areas of surface fire activity, typically down wind from passive or active crown fire areas.
The ![]() Spot Fire List has the both the launch and landing times, flight time and distance travelled. This same information also gets stored in the ♦ Spot Fire Locations vector theme when you save it as a shapefile.
Spot Fire List has the both the launch and landing times, flight time and distance travelled. This same information also gets stored in the ♦ Spot Fire Locations vector theme when you save it as a shapefile.
With the display pane still zoomed into the area north of the ignition double-click the ♦ Farsite Wind Vectors item to add it to the display.
An important concept to remember when viewing ♦ Farsite Wind Vectors is that the wind speed and direction used to initialize WindNinja can be different for each time step based on the data in the Weather Stream (.WXS) file, thus each perimeter may have very different wind vectors. This is obvious in the area of the spot fires discussed above. This is very different from the way a FlamMap run uses WindNinja, where a single wind speed and direction is used to initialize WindNinja for the entire landscape.
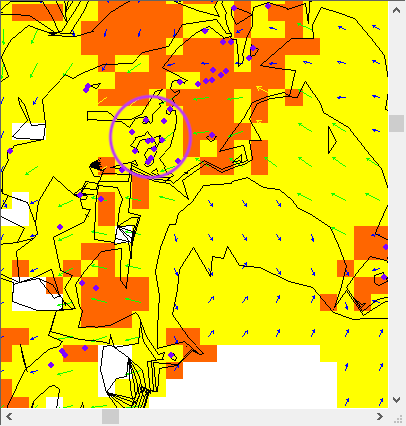 |
Wind vectors can also offer clues to the simulated fire behavior. Looking at the spot fires discussed above it appears that the winds that carried those embers (circled spots) to the west occurred during the previous time step with the east winds (green vectors) carrying embers from the torching (orange) crown fire activity area. |
The last vector theme of interest is the ♦ Farsite Spread Vectors. While leaving the other vector themes displayed add the ♦ Farsite Spread Vectors item by double-clicking. Notice that the spread vectors can be quite different from the wind vectors. The spread vectors show the additional effects of fuel, weather, and topography on the surface fire spread.
You now have completed this tutorial showing the basic steps in conducting a Farsite simulation.
Related Topics
 tool bar button.