

FlamMap can display a variety of output vector and Auxiliary themes.
Modifying the display of these is done in different ways depending on the vector type by right-clicking the vector and selecting the Properties command from the shortcut menu.
The properties dialogs for contours and vector themes are very similar. They are used to control how the contour or vector themes are shown in the "Display" pane.
|
|
|
Title: - The contents in this text box are shown as the tree item in the "Tree" pane. The default is the name of the shapefile for vector themes or the name of the source grid theme for contours. The contents can be edited by clicking in the text box.
Contour Interval: - For contours only, this is only for information. You cannot edit the contour interval in this dialog box. To change the contour interval you need to delete the current contour and create a new contour with the desired interval.
Source File Name: - For vector themes only, this path of the shapefile is for information only. To change the source file of the vector theme you should delete the current theme and add a New Vector Theme.
Visible - This check box controls whether the theme is visible or not in the "Display" pane. You can also control the visibility by double clicking the individual tree item.
Color: - You can control the color of your vector or contour theme by double-clicking the color box to display the "Color" dialog.
Line Style: - To change the line style of your vector theme or contour click the ![]() button in the text box and simply select one of the styles from the drop down list.
button in the text box and simply select one of the styles from the drop down list.
Line Width: - To change the line width of your vector theme or contour click the ![]() button in the text box and simply select one of the widths from the drop down list.
button in the text box and simply select one of the widths from the drop down list.
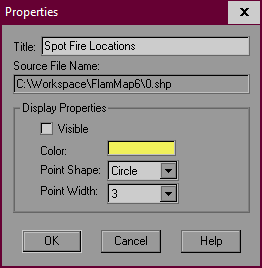 |
The properties dialog for Auxiliary point, ♦Ember Landing Locations, and ♦Spot Fire Locations vector themes are very similar. They are used to control how the points are shown in the "Display" pane. |
Title: - The contents in this text box are shown as the tree item in the "Tree" pane. The default is the name of the shapefile for vector themes or the name of the source grid theme for contours. The contents can be edited by clicking in the text box.
Source File Name: - This path of the point vector theme is for information only. To change the source file of the vector theme you should delete the current theme and add a New Vector Theme.
Visible - This check box controls whether the theme is visible or not in the "Display" pane. You can also control the visibility by double clicking the individual tree item.
Color: - You can control the color of your points by double-clicking the color box to display the "Color" dialog.
Point Style: - To change the point style of your vector theme click the ![]() button in the text box and simply select one of the styles from the drop down list.
button in the text box and simply select one of the styles from the drop down list.
Point Width: - To change the line width of your vector theme or contour click the ![]() button in the text box and simply select the relative size from the drop down list.
button in the text box and simply select the relative size from the drop down list.
♦Farsite Perimeters that are close together can mask the underlying grid or vector themes. The "Farsite Properties" dialog has additional options minimize their impact.
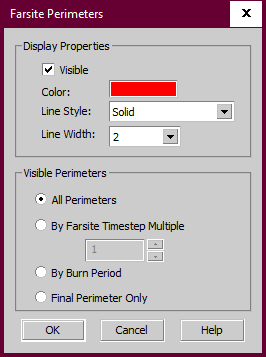
Color: - You can control the color of your perimeters by double-clicking the color box to display the "Color" dialog. You may want to pick a color that contrasts with the visible grid theme.
Line Style: - To change the line style of your perimeters click the ![]() button in the text box and simply select one of the styles from the drop down list.
button in the text box and simply select one of the styles from the drop down list.
Line Width: - To change the line width of your perimeters click the ![]() button in the text box and simply select one of the widths from the drop down list. A line width of "1" is often a good choice to minimize the impact of the perimeters on the other themes.
button in the text box and simply select one of the widths from the drop down list. A line width of "1" is often a good choice to minimize the impact of the perimeters on the other themes.
Several other options to reduce the number of perimeters are available in the Visible Perimeters area.
In addition to controlling the display of perimeters, the above option determine which perimeters are exported as a shapefile or KMZ.
♦Spread, ♦Max Spot, or ♦Wind Vectors are point shapefiles and contain attributes (in the .dbf file) that are used in the display. Thus the display properties and symbology of these shapefiles is different from other shapefiles in FlamMap.
The Properties or Options > Predefined Legends command displays the "Wind Vector Legend", "Max Spot Vector", or "Spread Vector Legend" dialogs. Although there are separate dialogs for each vector type, the only difference between the three is the display of units. So instructions for modifying the display of all vectors is the same.

The Theme: text box displays the name of the active theme you are modifying, you cannot change it here. To modify the legend of another theme you need to close this "Vector Legend" dialog and select another theme as the active grid and reopen the "Legend" dialog with the Properties command.
The high and low values of the active theme are displayed here for your reference. You cannot edit these, but look carefully as you can easily discover problems with your theme.
The Vector Output Section controls the width and spacing of the arrows depicting the ♦Spread, ♦Max Spot, or ♦Wind Vectors. Modifying the color and length of the arrows is described below.
Line Width: - This spin box controls the width of the display arrows. It refers to pixels so the actual width depends on your screen resolution. Typically if the default of 1 is too small a value of 2 or 3 will create easier to see arrows.
Display Density - Showing an arrow for each output grid cell can create a very confusing display. There are 2 ways you can control the density of arrows on the display.
Selecting the Auto radio button maintains the arrows at a fixed spacing regardless of how much you zoom in or out. You control the spacing with the Target Size (Pixels): spin box. So as you zoom in you will see additional detail (more arrows per area) and zooming out will reduce the detail. However the Vectors (arrows) are based on the underlying grids (ROS and Max Spread Direction for Spread Vectors, Velocity and Azimuth for Wind Vectors) so the density of arrows will not exceed one per grid cell.
The Manual radio button allows you to keep the display arrows at a constant density, regardless of the zoom. You control the density with the Rows/Cols to Skip: spin box. The default value of "0" places an arrow in the center of every underlying grid cell, a "1" skips every other cell, "2" skips two cells, etc.
You can display the magnitude (speed) of each arrow in the Text Output section. Select the Output Speed check box to display the speed value next to each arrow in your display. You can control the text size and precision with the Font Point Size: and Decimal Places: spin boxes.
The unit choices for the active theme are shown in the Velocity Units: drop-down lists. A variety of velocity units in appropriate English and metric units are available to choose from within each vector theme. Changing the Velocity Units: will convert the values and legend for the theme. Unexpected results can occur when converting units, see the Converting Units topic for more information.
You can easily change the number of legend classes with the Number of Classes: spin box. This creates an evenly distributed number of legend classes across the data range. To create a legend with unevenly distributed classes or eliminate outlying values, use the procedures described in the Changing the Legend Classes.
CAUTION: The use of evenly distributed classes can hide much of the interesting information in your theme. Typically in fire behavior, the information of interest is not evenly distributed, it's clustered at the low end of the scale. Also a single cell or point with a very high value can skew the legend. Spend the time to explore different legend arrangements.
Changing colors and using a Predefined Legend or Color Ramp for ♦Spread, ♦Max Spot, or ♦Wind Vectors is identical to the methods used for grid themes.
The Relative Length values control the length of the display arrows for each class, small values create short arrows and larger values display longer arrows. By default the relative length begins with "1" for the smallest class and increments each class by one. The default increments may be hard to discern in the "Display" Pane so you can change the relative length values in several ways:
first, you can simply select a relative length value with the cursor and change it from the keyboard,
second, you can ramp values by shift-clicking a range of rows and then right-clicking to display the short cut menu with the Auto Ramp and Define Ramp commands. Selecting the Auto Ramp command will ramp the relative lengths between the existing top and bottom selected values. The Define Ramp command gives you the opportunity to define the top and bottom values in the "Set Relative Length Ramp" dialog before ramping.
Usually lengths of "1" or "2" are too small to discern differences and values greater than "25" tend to be too big.
Once you have a legend built in the "Create/Modify Legend" dialog you can save it as a Predefined Legend to use for similar vector themes in other FlamMap Runs or Projects.
To save edits as a Predefined Legend click Save As at the bottom of the "Create/Modify Legend" dialog to open the "Enter Legend Name" dialog.

Enter a name (spaces and punctuations are valid) and click OK.
At this point the edits are only saved in the new Predefined Legend, not for the vector theme display or an existing Predefined Legend being edited. At this point clicking OK or Cancel in the "Create/Modify Legend" dialog can have unintended results.
Clicking OK will save the edits to the displayed vectors or existing Predefined Legend even if the a new Predefined Legend has been saved. If editing an existing Predefined Legend this creates two identical Predefined Legends with different names.
Clicking Cancel will not change the displayed vectors or the existing Predefined Legend but new Predefined Legends will be saved.