This lesson gives you some tricks for viewing and interpreting MTT outputs. It uses the vector and grid outputs generated in the Minimum Travel Time lesson. You do not necessarily have to use the Tutorial project data for this lesson, you can use outputs from a different landscape, just be sure you have all the output themes. This lesson assumes you have some experience using FlamMap to modify legends, changing units, and displaying different themes. If you do not have these skills, first complete the Basic Lessons. If you need to review these skills you can click on the blue links in this lesson as you need to, which refer to the online help system.
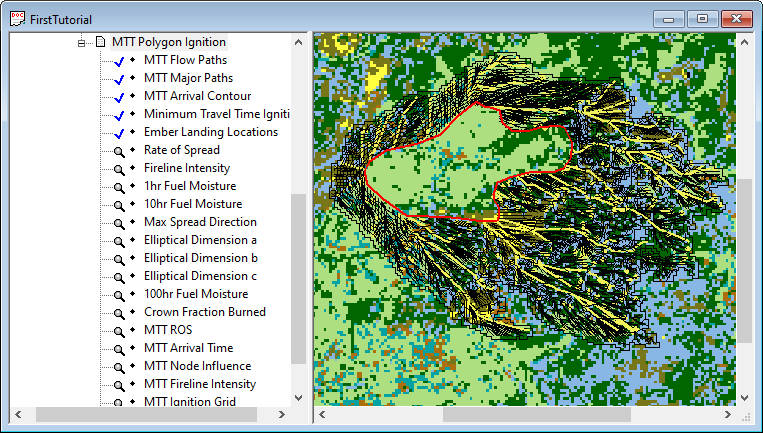
After completing the run, closing the "Run:" dialog box, expanding the run item in the "Tree" pane, and zooming your display, your project window will look something like this.

In addition to the outputs selected the following output items are also generated for every MTT run.
Minimum Travel Time Ignitions
Max Spread Direction
Elliptical Dimension a
Elliptical Dimension b
Elliptical Dimension c
Run Log
The Max Spread Direction and Elliptical Dimensions outputs are designed as inputs for other applications and will not be discussed in this lesson. You can find out more on these grids by clicking on the above links.
Select the ♦MTT Arrival Time item so that it is the active theme in the "Display" pane.
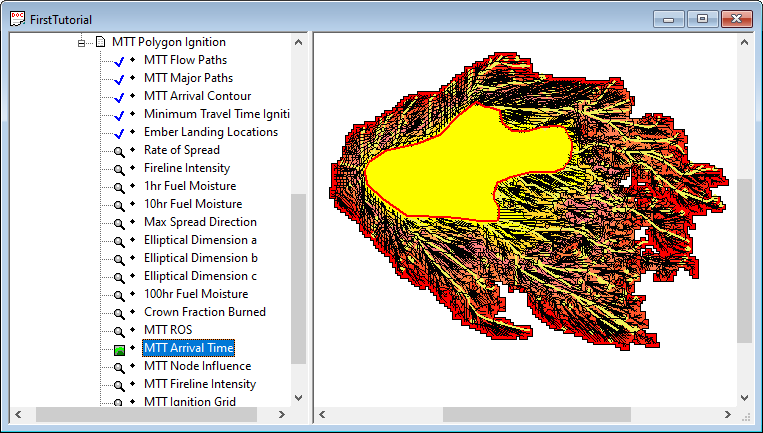
You can now easily see the perimeter of the fire simulated. If you haven't already, Zoom in so that the simulated fire mostly fills the "Display" pane.
Turn off (by double-clicking) the vector output items ♦MTT Flow Paths and ♦MTT Major Paths to make viewing easier.
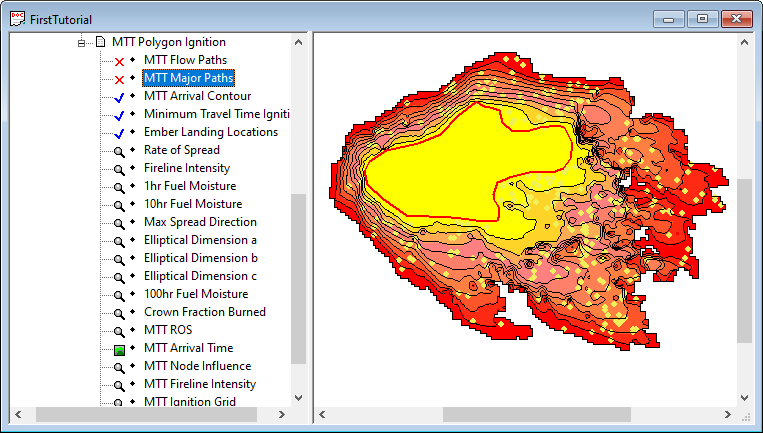
The yellow dots are the ♦Ember Landing Locations vector item. Remember spotting is a stochastic process and the exact number and landing locations of embers in your view may be different than shown above. Also, ♦Ember Landing Locations do not necessarily equate to spot fires - only where embers landed.
View the ♦Ember Landing Locations and switch between the ♦Fuel Model and ♦Canopy Cover landscape themes as the background and note the conditions where the spotting is taking place.
Again select ♦MTT Arrival Time grid as the background.
|
|
The default legend (View > Legend command) has the ♦MTT Arrival Time values sorted into 10 classes and color ramped with the yellow cells burning early in the simulation and the red cells burning last. The white No Data cells were not "burned" in the simulation. The values are in approximately 60 minute classes (600 minutes/10 classes) and the decimal places have been set to zero for this example. |
The ♦MTT Arrival Contour item is simply a contour of the ♦MTT Arrival Time grid. Turn off (by double-clicking) the vector output item ♦Ember Landing Locations to make viewing easier.
|
|
To view the contour properties right-click the ♦MTT Arrival Contour item in the "Tree" pane and select the Properties command from the shortcut menu. Looking at the Contour Interval you can see it is very close to 36 minutes. The default contour interval is the maximum ♦MTT Arrival Time grid value divided by ten so in this simulation each contour is 36 minutes. You can also modify the color, style, & width of the contours with this dialog box. But to change the contour interval you need to create a new contour which will be created as a Auxiliary Theme item in the "Tree" pane. |
You can look at the contours as fire progression perimeters, but remember to consider the assumptions in setting the simulation time period. In this simulation the scenario simulated was a six hour burning period.
Next view the ♦MTT Major Paths vector item, this is a subset of the ♦MTT Flow Paths vector item which is easier to view and interpret. The number of paths shown as major paths is controlled by the Interval for Minimum Travel Paths setting on the Minimum Travel Time tab.
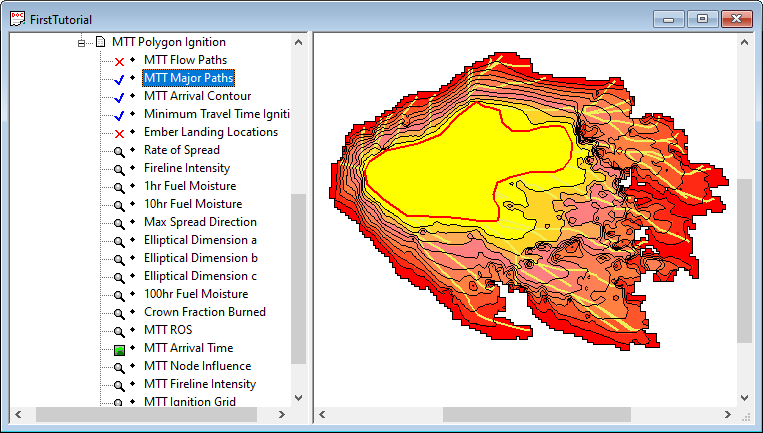
By displaying all paths with the ♦MTT Flow Paths vector item you can see how the simulated fire got to each of the arrival time cells (the upper left corner of a cell is the path node).
Display the ♦MTT ROS grid and turn off or change the color of the ♦MTT Major Paths vector item. Notice the higher rates of spread occur where the arrival time contours are the widest.
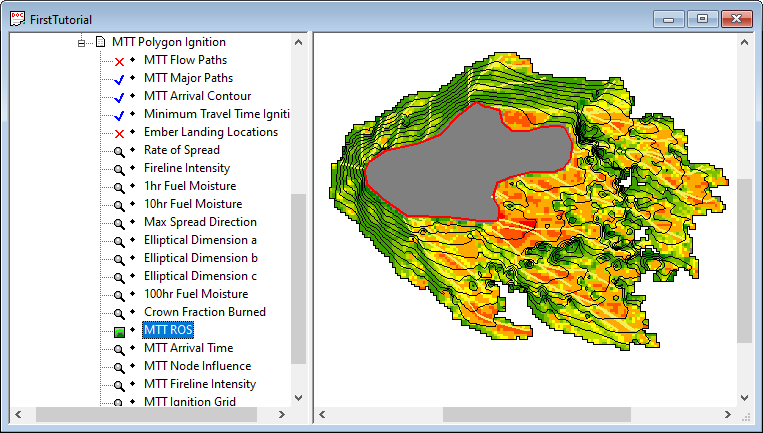
You may have already realized there are two rate of spread grids in this run, the ♦Rate of Spread item and the ♦MTT ROS item. Don't confuse yourself by assuming they are the same thing. View both themes and you will notice that the ♦Rate of Spread values are calculated for the entire landscape while the ♦MTT ROS values are only for the simulated fire area. Here's how to compare the rate of spread values for each grid.
|
|
Before comparing individual cells for the two themes make sure they have the same unit, chains per hour in the example to the left. Display the ♦MTT ROS item and double-click one of the mid value cells within the simulated fire to bring up the "Point Attributes" dialog. Select the MTT Polygon Ignition tab to show all the output grid values for the point you double-clicked. You will see that the ♦Rate of Spread values are usually higher than the ♦MTT ROS values. This is because the ♦Rate of Spread value is the maximum rate of spread for the cell while the ♦MTT ROS value is for the spread direction for the path the simulated fire took through the cell. This is very obvious when you query cells in areas where the simulated fire was obviously backing downhill or into the west wind. |
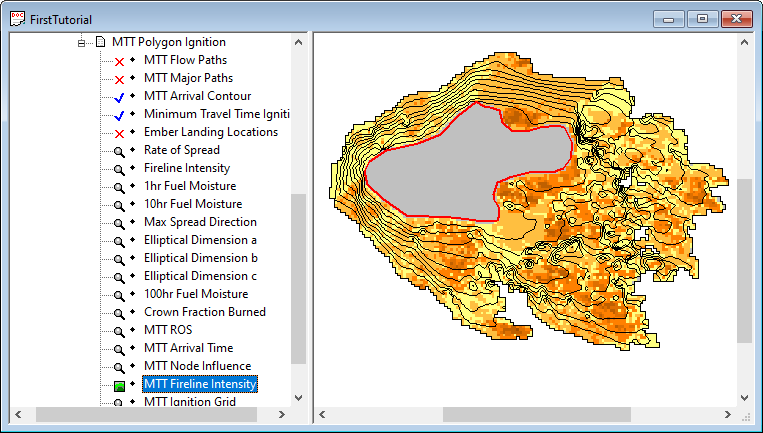
The ♦MTT Fireline Intensity grid displays the fireline intensity only for the simulated fire. As with the MTT ROS grid discussed above there is a corresponding ♦Fireline Intensity grid for the entire landscape which is different from the ♦MTT Fireline Intensity grid. The ♦Fireline Intensity grid shows the intensity if the fire was spreading in direction of maximum spread rate while ♦MTT Fireline Intensity grid shows the intensity with the spread direction of the simulated fire.
The ♦MTT Node Influence grid shows the relative importance of each cell to the spread of the fire.
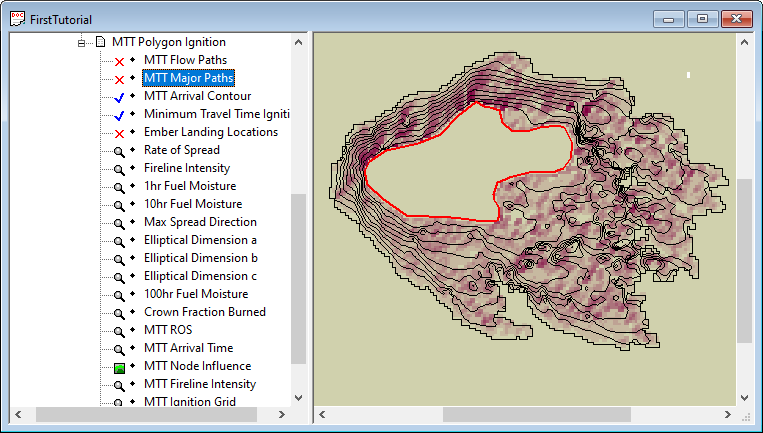
In this example the darker maroon cells are most important to the simulated fire spreading as it did. One way to view this theme is that when the "fire" spreads through a red cell it goes on to burn more additional cells than when the "fire" spreads through a grey cell. You can see the major paths go through the most important cells, in fact the ♦MTT Major Paths vector theme is derived from the ♦MTT Node Influence grid.
You should save this project by following the procedures from the first lesson. Keep the project name "FirstTutorial.fmp".
The MTT method of simulating fires can be confusing and difficult to grasp. However it does bring us new ways of looking at fire spread which will be important in using the conditional burn probability and Treatment Optimization Model (TOM) features of FlamMap. So take some time to further explore MTT methods, create new ignitions on the tutorial landscape, change the MTT or weather setting for this example, and try out your own landscapes. Remember any Landscape File, even those created outside of FlamMap, can be used for an MTT run.
You can now move on to either the Burn Probability or Treatment Optimization Model lessons. It makes no difference which one you choose to do next.